The main SMART Diagnostics window
You can view and change SMART Diagnostics software settings to suit your needs.For example, you can do the following:
Start, stop and clear message logs
Perform a trace test
Generate a local report
See which SMART products are connected
View status information about the connection
View or change the mode in which your SMART product is operating
Check the operation of the pen tray tool sensors
Orient the interactive whiteboard
The Log window displays a variety of status messages, including the following:
Voltage and resistance information
Communication specifications and settings
Troubleshooting and debugging information
You can stop and start the message log generated by SMART Diagnostics.
To stop the message log
Click Stop Logging
 , or you can click Messages > Stop Logging.
To start the message log
Click Start Logging
 , or you can click Messages > Start Logging.
You can clear the message log window and the log file.
To clear the log
Click Clear
 , or you can select Messages > Clear Log.
You can use the Trace test to verify that pen and finger touches register over the entire surface of the interactive screen.
The Trace window displays the precise x,y coordinates that correspond to points of constant or intermittent contact with the interactive screen. This window provides you with a visual counterpart to the x,y coordinates that are logged in the main message window when any contact is made with the interactive screen.
To trace screen contact
Click Trace
 , or select Tools > Trace.
Touch the interactive screen.
The points of contact appear as segments, dots or dotted segments.
To run a Trace test
Using a pen tray pen, slowly draw five diagonal lines in each corner of the screen.
Note
You must use a pen, not your finger, to draw the lines in this procedure.
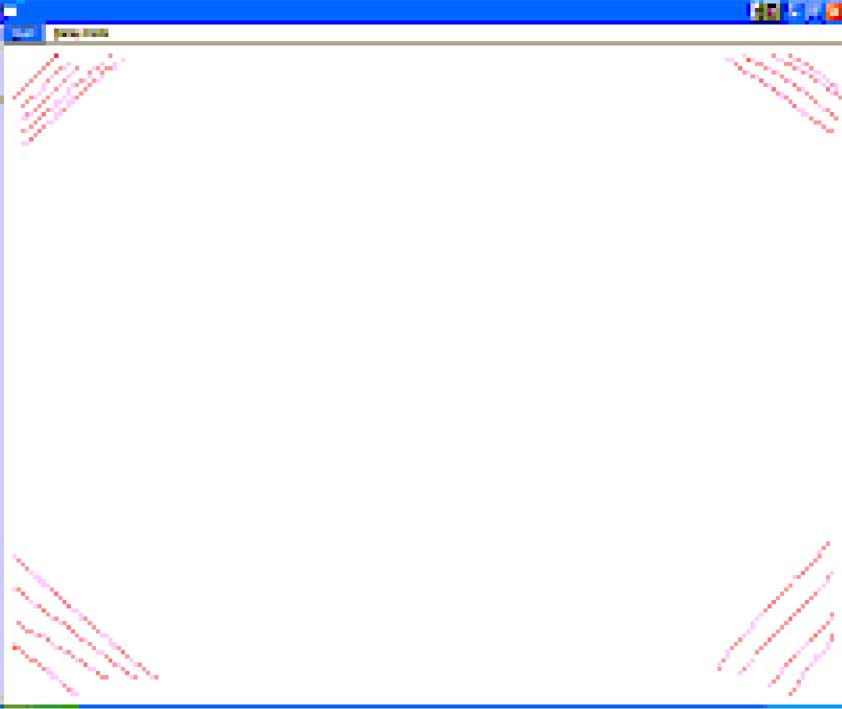
If your SMART product uses DViT technology and you see a break in any of the lines, take a snapshot of the camera views to help diagnose the problem.
Slowly draw a pattern similar to the figure below. Be sure to include
a rectangle along the edge of the screen
two diagonal, oscillating lines that intersect in the center of the screen
a circle in the middle of the screen
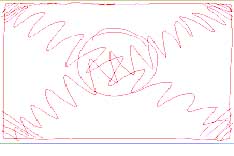
If you see any breaks in the pattern, try drawing in that area again. If the area is still unresponsive, take a snapshot of the system to diagnose the problem.
If you see any waves in the lines, and your system uses DViT technology, calibrate the cameras to eliminate this problem.
Note
If you encounter a problem, save an image of the trace pattern. You can capture it to a SMART Notebook software or Whiteboard page using the Screen Capture tool.
Press Esc to close the Trace window.
Tip
To capture the screen when in Trace mode in Windows, hold down Shift > PrntScrn OR left-click mouse on Pen tool > Tools > Capture.
To capture the screen when in Trace mode in OS X, hold down Command > shift > 3.
In Windows you can use the Report button to create a
 ReportLog.html report file summarizing the hardware and software characteristics of the computer system and all connected SMART products. The ReportLog.html report file automatically opens in a browser window, or you can open it from the user’s temp folder (C:\Users\{User Name}\AppData\Local\Temp\ReportLog.html).
In OS X the report is generated in a random folder under var/folders.
Note
To save the report to a different location or to e-mail the report file, see Using the Report menu in SMART Diagnostics.
You can use the toolbar indicators to verify that your SMART interactive product’s eraser and pen tool systems are communicating properly with the software.
When the eraser and pen tool systems communicate properly with the computer, the corresponding indicator on the toolbar illuminates when you select your SMART interactive product’s eraser or a pen.


Notes
If you select more than one tool on single touch boards, the indicator for the last tool you selected illuminates. For multi-touch boards, SMART Diagnostics can detect multiple pens that have been picked up, and all indicators will be illuminated.
To log the tool activity, select Show Processed Data from the Messages menu.
If you don’t have a projector for your interactive product, you can use your interactive product in Non-Projected mode. You can write on the interactive product in Non-Projected mode with dry-erase markers and save your notes in a .notebook file.
Caution
Check your interactive product’s installation guide for more information before writing on it with dry-erase markers. For example, don’t write on an interactive product if it has an OptiPro surface. OptiPro surfaces are optimized for use with Projected mode.
Note
This option isn’t available if you are using a SMART Board 800 series interactive whiteboard, a SMART Board 8000i interactive flat panel or a LightRaise 40wi interactive projector.
To enable Non-Projected mode
Select the Non-Projected (Whiteboard Mode) option in the Mode area of the main diagnostics window.
Note
To disable Non-Projected mode, select Projected (Mouse Mode).
Perform an orientation to ensure that the system accurately tracks your finger or pen tray tool on the screen.
The orientation procedure has 4, 9, 12 or 20 targets, depending on the orientation level you select (see Configuring settings with SMART Product Drivers 12 and SMART Ink 5).
To orient the interactive product
Click the Orient button in the top-right of the SMART Board Diagnostics window to start an orientation at the precision selected.
Note
You can also press the orientation button on your interactive product.
The Orientation screen appears.
Press the center of each target in the order indicated on the screen.
Notes
To effectively orient the interactive product, press an area near each target, and then slide your finger or pen to the center of each target before removing it. Keep your finger or pen perpendicular to the interactive product’s surface.
You can orient a target again by pressing the two pen tray buttons simultaneously or the Left Arrow key on the keyboard.
To close the orientation screen before finishing the orientation procedure, press ESC.
After you press the final target, the Orientation screen closes.
Keywords |
|
Related documents |